
Key Takeaways: Market Sizing Beyond Guesswork
- TAM is Not an Assumption; It’s a Macro Reality. Don’t just pull a multi-billion-dollar number from a report. Use a PESTLE Analysis to quantify how macroeconomic forces, regulatory landscapes, and social trends actually expand or restrict your Total Addressable Market. External forces define your playground before you ever step on it
- SAM Isn’t Demographics; It’s the Value Chain. Your Serviceable Available Market is defined by infrastructure, not just a customer avatar. Run a Value Chain Analysis to honestly evaluate your capabilities. Where your operations, logistics, and distribution end is where your SAM ends. You cannot serve a market your value chain can’t reach
- Your SOM is Only as Strong as Your Differentiation. A realistic Serviceable Obtainable Market isn’t a percentage carve-out; it’s the result of competitive positioning. Assess Porter’s Five Forces and industry rivalry to understand existing competitive intensity. Pair this with an internal SWOT Analysis to determine if you have the distinct advantage required to win this specific segment in the short term
- SOM Requires Tactical Implementation Planning. Identifying your SOM is academic; obtaining it is execution. Moving from “O”btainable to obtained requires prioritizing actionable, high-ROI tactics using the TOWS Matrix & Prioritisation to turn opportunities into revenue
- Data Clarity is Your Primary Competitive Advantage. Stop relying on disconnected spreadsheets and fragmented estimations. Utilize a structured system like the Strategic Analysis Toolkit to automate these complex validations, turning raw market data into a defensible, boardroom-ready strategic roadmap
Every pitch deck boasts a multi-billion-dollar Total Addressable Market (TAM). Yet nine out of ten startups still fail.
The problem isn’t a lack of vision; it’s a lack of precision. Investors and board members see through top-down estimates that carve out an arbitrary 1% of a massive industry. When your market sizing relies on top-level assumptions rather than structural reality, you risk wasting capital on unwinnable segments, misallocating sales resources, and losing credibility with stakeholders.
To calculate TAM, SAM, and SOM, you must bridge the gap between high-level market data and operational execution. This requires proven strategic frameworks.
What Are TAM, SAM, and SOM?
Before diving into the analysis, let’s define clear baselines:
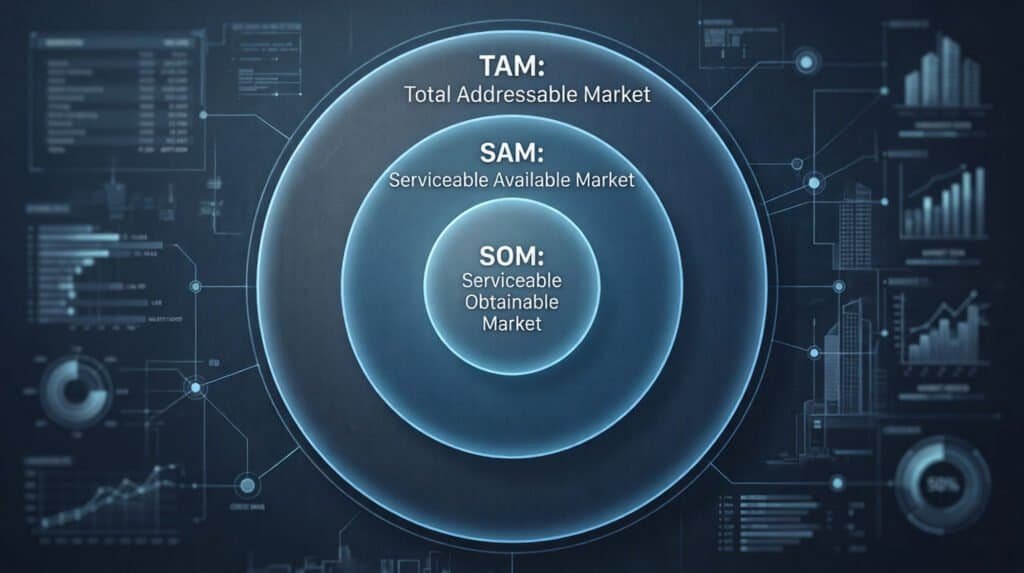
- TAM (Total Addressable Market): The total global market demand for a product or service
- SAM (Serviceable Available Market): The TAM segment targeted by your products and services within your geographical or technological reach
- SOM (Serviceable Obtainable Market): The portion of SAM you can realistically capture, given your resources, competition, and operational constraints
Phase 1: How Do You Define Macro TAM and Industry SAM?
Calculating TAM requires understanding external constraints. Market potential isn’t static; it shifts with macroeconomic trends, regulatory environments, and industry competition.
How Is a PESTLE Analysis Used to Validate TAM?
A PESTLE Analysis examines Political, Economic, Social, Technological, Legal, and Environmental factors. Using PESTLE helps prevent overestimating TAM by identifying regulatory barriers or economic shifts that constrain overall market capacity.
How Do Porter’s Five Forces and Value Chain Analysis Support SAM Estimation?
To narrow TAM to your Serviceable Available Market (SAM), you must analyze the industry structure:
- Porter’s Five Forces: Evaluates buyer bargaining power, supplier power, threat of substitutes, threat of new entrants, and competitive rivalry. If supplier power is high or the threat of substitutes is significant, your addressable market shrinks.
- Value Chain Analysis: Maps out internal and logistics workflows. This confirms whether your current supply chain, delivery capabilities, and infrastructure can effectively serve target SAM segments.
Phase 2: How Do You Convert SAM into a Realistic SOM?
Your Serviceable Obtainable Market (SOM) is the customers you can capture over the next 12–36 months. Calculating this metric requires evaluating your internal execution and positioning strengths.
How Are SWOT Analysis and the GOST Framework Applied to Strategy?
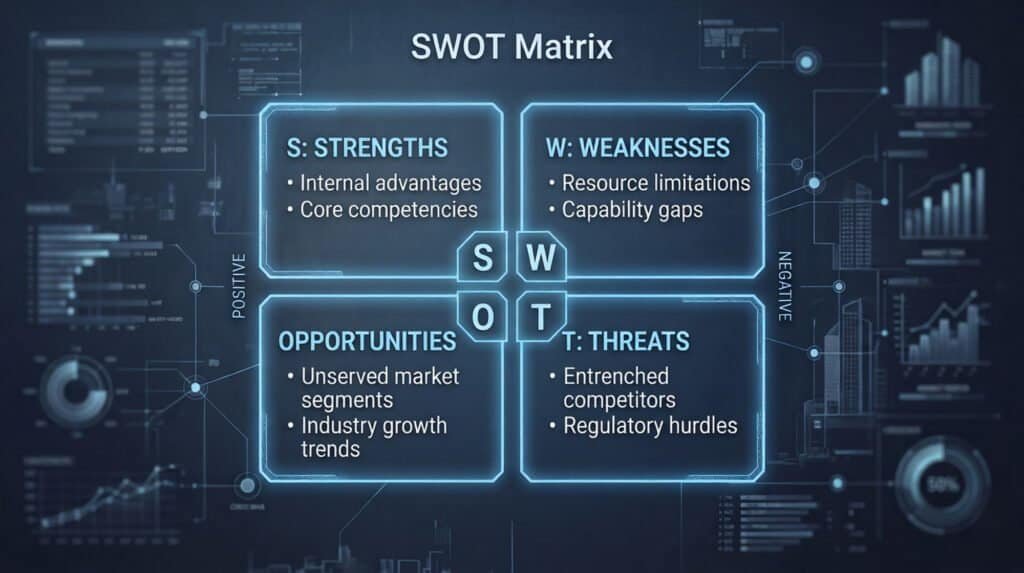
Conduct a structured SWOT Analysis (Strengths, Weaknesses, Opportunities, Threats) to identify your competitive edge. Pair it with the GOST Framework (Goals, Objectives, Strategies, Tactics) to ensure your short-term objectives align with your achievable market share target.
How Can the Ansoff Matrix and Blue Ocean Strategy Help Identify Market Opportunities?
To expand your SOM without entering into margin-killing price wars:
- Ansoff Matrix: Evaluates risk across four growth pathways: Market Penetration, Market Development, Product Development, or Diversification
- Blue Ocean Strategy: Identifies uncontested market spaces, rendering competition irrelevant and unlocking new consumer demand
Phase 3: How Do You Execute a Market Capture Plan?
Defining SOM on paper is only half the battle. Capturing it requires systematic execution and continuous iteration.
How Does a TOWS Matrix Help Prioritize Strategic Initiatives?
A TOWS Matrix pairs your SWOT findings, aligning internal capabilities with external market conditions to generate actionable strategic options. Use TOWS Prioritization to rank projects by ROI, ensuring resources are directed toward high-yield SOM channels.
How Are the Balanced Scorecard and PDCA Cycle Used to Monitor Execution?
Track your progress with a Balanced Scorecard covering financial performance, customer metrics, internal processes, and growth goals. Enforce a continuous PDCA cycle (Plan-Do-Check-Act) to refine go-to-market strategies using real feedback.
How Can You Streamline Market Sizing and Strategy Execution?
Running PESTLE, Porter’s Five Forces, SWOT, TOWS, and Balanced Scorecards manually takes weeks and produces fragmented slide decks and disconnected spreadsheets.
With the Strategic Analysis Toolkit, you can automate and structure your entire strategic roadmap. Move from raw market research to board-ready strategic frameworks in a fraction of the time.
Frequently Asked Questions
What is the main difference between TAM, SAM, and SOM?
TAM (Total Addressable Market) represents the total global demand for a product or service if there were zero competition or constraints. SAM (Serviceable Available Market) narrows TAM down to the specific segment you can reach based on your geographic, technical, or regulatory limitations. SOM (Serviceable Obtainable Market) is the realistic portion of SAM you can capture within 12–36 months, factoring in your current resources, budget, and competition.
Why do investors reject top-down market sizing estimates?
Investors often reject top-down estimates, such as claiming “if we get just 1% of a $100B market, we’ll make $1B”, because they rely on arbitrary macro statistics rather than operational reality. Top-down figures ignore execution barriers, competitive resistance, customer acquisition costs, and supply chain constraints.
How do frameworks like PESTLE and Porter’s Five Forces help in market sizing?
Strategic frameworks prevent overestimating your market size by introducing real-world constraints. PESTLE analysis identifies macroeconomic, legal, and political factors that shrink your true TAM. Porter’s Five Forces evaluates competitive intensity, supplier power, and buyer power, helping you define a realistic SAM by ruling out unprofitable or unreachable market segments.
How far out should my SOM forecast extend?
A standard SOM calculation typically covers a 12 to 36-month timeline. This timeframe aligns with short-to-medium-term operational goals, resource allocation, and realistic go-to-market execution capabilities before long-term market dynamics shift significantly.
How can I grow my SOM without entering a price war?
You can expand your SOM by using strategic frameworks like the Ansoff Matrix and Blue Ocean Strategy. Rather than competing head-to-head on price, these frameworks help you identify uncontested market spaces, enter new customer segments, or launch complementary product capabilities that create new demand.
What tools can help streamline market sizing and strategic planning?
Instead of manually building disconnected spreadsheets and slide decks for each strategic analysis, you can use structured platforms like the Strategic Analysis Toolkit. This automates frameworks like PESTLE, Porter’s Five Forces, SWOT, and TOWS to move from raw research to board-ready market calculations quickly.