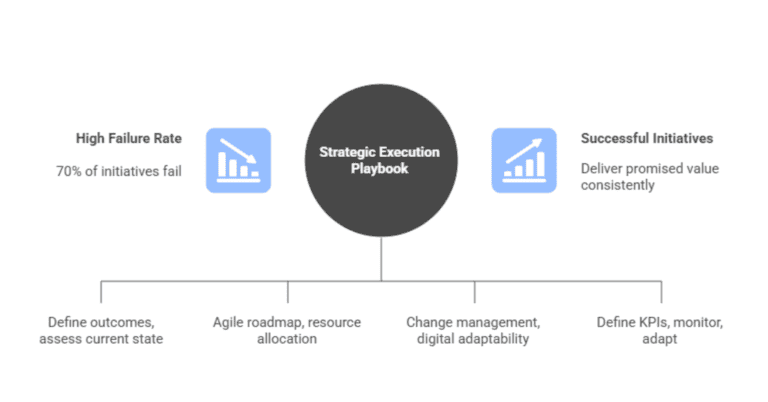
It is the most frustrating scenario in business: The CEO has a clear, compelling vision. The strategy is sound. The market opportunity is massive. Yet, six months later, nothing has changed. Sales teams are chasing the wrong leads, product development is stalled on low-priority features, and customer service is overwhelmed.
This is known as the “Execution Gap.”
According to research frequently cited in management circles, up to 90% of organizations fail to execute their strategies successfully. They don’t fail because the strategy was bad; they fail because they couldn’t translate high-level goals into their employees’ day-to-day actions.
Why does this happen? For decades, the primary culprit was tunnel vision on financial metrics. Most executive dashboards look like a rearview mirror. They tell you exactly what happened last quarter, revenue, profit, ROI, but offer zero insight into what is happening today that will determine your success tomorrow.
If you are driving a car solely by looking in the rearview mirror, you are going to crash.
Enter the Balanced Scorecard (BSC). It is not just a measurement tool; it is a strategic management system designed to bridge the gap between vague mission statements and operational reality.
In this guide, we will dismantle the “finance-only” mindset and show you how to build a Balanced Scorecard that aligns every department, from the C-suite to the front line, toward a single, unified vision.
What is a Balanced Scorecard?
The Balanced Scorecard was introduced in the early 1990s by Dr Robert Kaplan and Dr David Norton in a seminal Harvard Business Review article. At the time, it was a radical idea. The business world was obsessed with financial reporting. Kaplan and Norton argued that while financial measures are essential, they are inadequate for guiding an organization’s future direction.
They proposed a “balanced” view; one that weighs financial health alongside the drivers of future value, such as customer satisfaction, internal process efficiency, and organizational innovation.
The Cockpit Analogy
Think of your business like a jet airplane.
- Financial metrics are your fuel gauge. You absolutely need fuel to fly; if you run out, you crash. But “having fuel” is not the destination. You cannot pilot a plane by only looking at the fuel gauge.
- The Balanced Scorecard is the rest of the cockpit dashboard. It tells you your altitude (market position), your speed (process efficiency), your bearing (customer alignment), and the health of the crew (employee engagement).
By monitoring all these dials simultaneously, a pilot can make minor real-time corrections to ensure the plane reaches its destination. That is what a BSC does for a CEO.
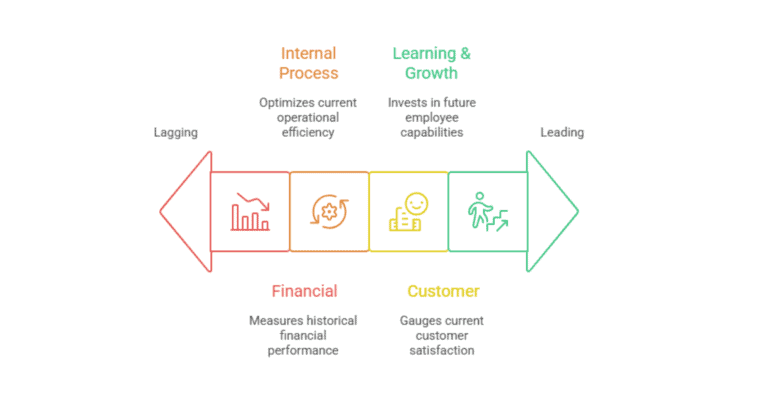
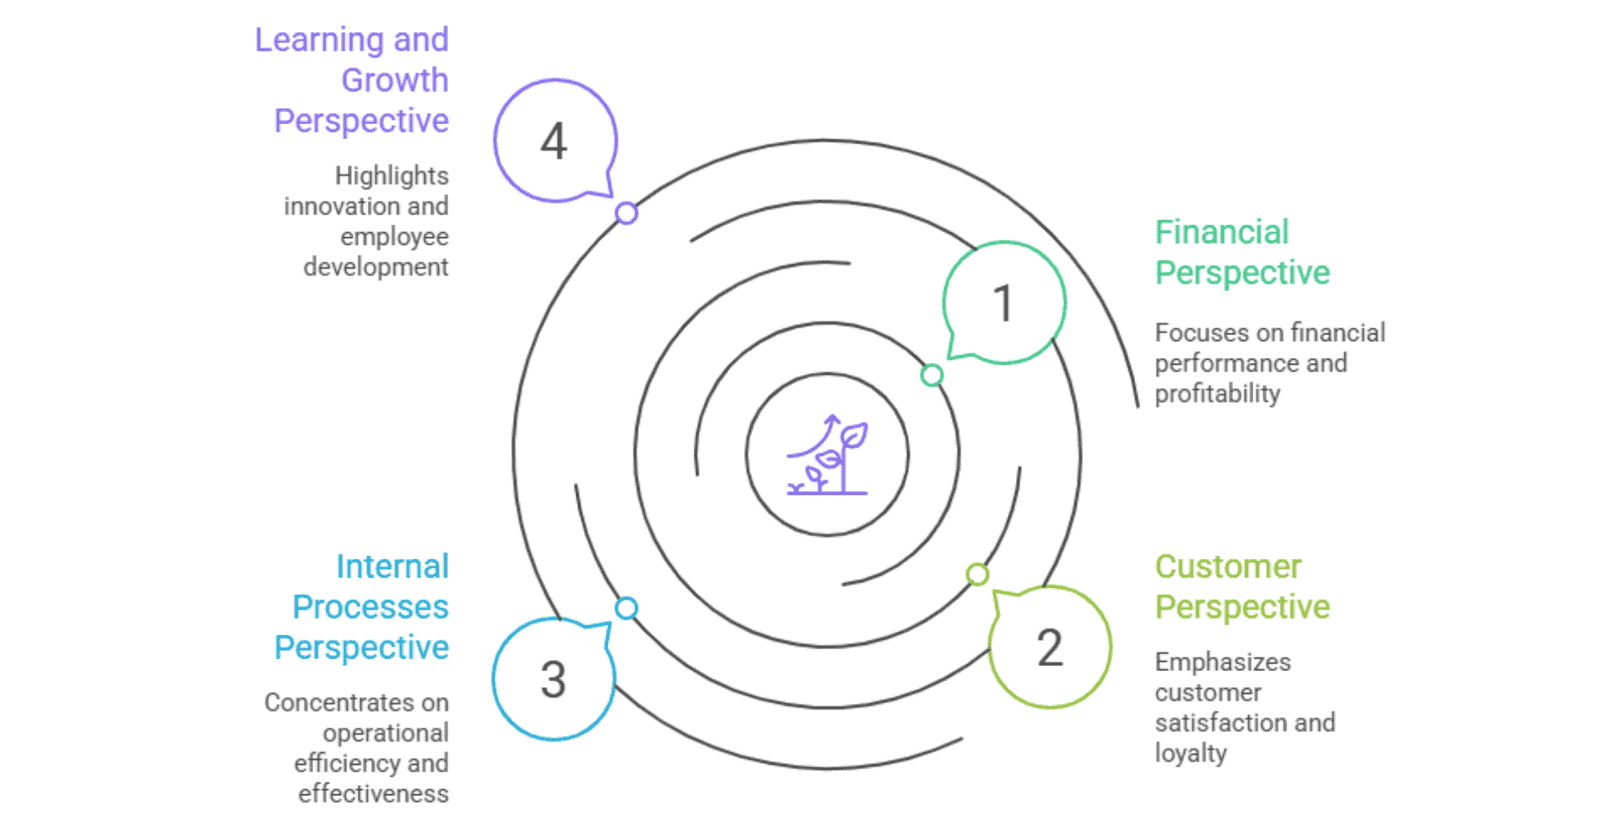
The Four Perspectives: A Framework for Success
The power of the Balanced Scorecard lies in its structure. It forces leaders to view their organization through four distinct yet interconnected perspectives.
The Financial Perspective
“To succeed financially, how should we appear to our shareholders?”
Even in a balanced approach, financials remain critical. They are the ultimate lagging indicator of whether your strategy is working. However, a robust BSC goes beyond simple “Revenue” or “Net Profit.”
It asks more profound questions about financial health:
- Revenue Mix: Are we growing by selling old products to old customers, or new products to new segments?
- Cost Structure: Are we reducing unit costs while maintaining quality?
- Asset Utilization: How efficiently are we using our cash and equipment?
Common Metrics: Return on Investment (ROI), Cash Flow, Revenue Growth Rate, Profit Margin by Segment.
The Customer Perspective
“To achieve our vision, how should we appear to our customers?”
Financial success is a result, not a cause. The cause of revenue is a customer deciding to pay for your product. This perspective forces the organization to look outward. It is not enough to think you are great; your customers must agree.
This perspective usually falls into one of three strategic themes:
- Operational Excellence: We are the cheapest or fastest, e.g., McDonald’s.
- Product Leadership: We have the best, most innovative product, e.g., Apple.
- Customer Intimacy: We offer the best service and tailored solutions, e.g., Ritz-Carlton.
Your metrics here must align with your chosen theme. If you claim “Customer Intimacy” but measure success by “Call Handling Speed” (rushing customers off the phone), your scorecard is broken.
Common Metrics: Net Promoter Score (NPS), Customer Satisfaction (CSAT), Market Share, Customer Retention Rate.
The Internal Process Perspective
“To satisfy our shareholders and customers, at what business processes must we excel?”
This is where the rubber meets the road. If the Customer Perspective tells you what people want, the Internal Process Perspective tells you how you will deliver it efficiently.
This perspective identifies the workflows that have the most significant impact on customer satisfaction. It forces you to stop optimizing everything and start optimizing the right things.
For an e-commerce giant, the critical process might be logistics and delivery speed. For a pharmaceutical company, it is the R&D pipeline and the speed of regulatory approvals.
Common Metrics: Cycle Time, Unit Cost, First-Pass Yield (Quality), Order Fulfillment Time, New Product Introduction Rate.
The Learning & Growth Perspective
“To achieve our vision, how will we sustain our ability to change and improve?”
This is the foundation of the entire structure. You cannot improve processes (Perspective 3) if your people lack skills. You cannot delight customers (Perspective 2) if your employees are burnt out. And you cannot make money (Perspective 1) if your technology is obsolete.
Kaplan and Norton identified three forms of capital here:
- Human Capital: Do our people have the right skills?
- Information Capital: Do we have the data and infrastructure to support our strategy?
- Organization Capital: Do we have the culture and leadership to drive change?
Common Metrics: Employee Turnover Rate, Training Hours per Employee, Employee Satisfaction (eNPS), Technology Adoption Rates.
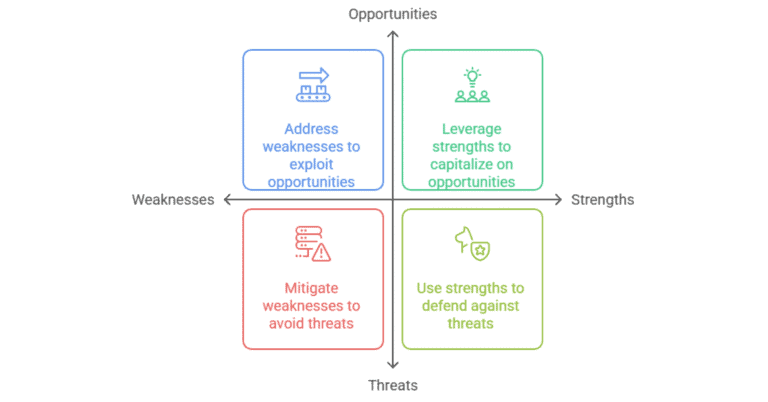
The Chain of Cause and Effect
The “Secret Sauce” of the Balanced Scorecard isn’t just measuring these four areas; it’s understanding how they link together. This is often visualized in a Strategy Map.
Here is how the logic flows:
- IF we train our employees and give them better tools (Learning & Growth)…
- THEN they will fix our order processing system and reduce errors (Internal Process)…
- THEN customers will receive their packages faster and be happier (Customer)…
- THEN they will buy more and refer their friends, leading to higher profits (Financial).
If you miss this linkage, your scorecard is just a list of KPIs. With the linkage, it becomes a story of your strategy.
Why the Balanced Scorecard Still Matters in 2025
You might wonder if a framework from the 90s is still relevant in the age of AI and Agile. The answer is yes, perhaps more than ever.
1. It Fixes “Remote Alignment” Issues. With hybrid and remote work becoming the norm, keeping teams aligned is harder. A BSC provides a “North Star.” A developer coding in London and a sales rep in New York can both review the scorecard to see how their specific KPIs contribute to the company’s financial goals.
2. It Prioritizes Resource Allocation. In modern business, there are always 100 “good ideas.” The BSC acts as a filter. If a proposed project doesn’t improve a metric on the scorecard, why are we doing it? It empowers leaders to say “no” to distractions.
3. It Integrates with OKRs. Many modern tech companies use OKRs (Objectives and Key Results). The BSC and OKRs play well together. The BSC provides the long-term strategic structure (the yearly view), while OKRs provide the quarterly, agile tactics to move those scorecard needles.
Step-by-Step: How to Build Your First Scorecard
Building a scorecard is a journey, but here is the roadmap to get started.
Step 1: Define the Vision
You cannot measure success if you haven’t defined it. Don’t just say “We want to grow.” Be specific: “We want to become the dominant provider of cybersecurity software for mid-sized banks in Europe.”
Step 2: Choose Your Perspectives
Stick to the standard four (Financial, Customer, Process, Learning) for your first iteration. If you are a non-profit or government agency, flip the model: Put “Customer/Stakeholder” at the top, as your goal is impact, not profit.
Step 3: Select Objectives and Measures
Warning: Do not clutter your dashboard. A common mistake is tracking 50 metrics.
- Limit yourself: Aim for 2-3 objectives per perspective.
- Mix your indicators: Ensure you have both Lagging Indicators (outcomes like Revenue) and Leading Indicators (predictors like “New Sales Calls Made”).
Step 4: Set Targets
A metric without a target is just a number. Define:
- Threshold: The minimum acceptable level (Red).
- Target: The goal (Green).
- Stretch: The ambitious “moonshot” (Star).
Step 5: Map Initiatives
This is where strategy turns into action. For every red metric on your scorecard, there must be a specific initiative (project) assigned to a specific owner designed to turn it green.
Common Pitfalls to Avoid
- The “Frankenstein” Dashboard. Don’t just paste together every metric every department head wants. If you try to focus on everything, you focus on nothing. A BSC should be a curated selection of the most critical drivers of strategy.
- Top-Down Tyranny. Don’t build this in a dark room with only C-level executives. If middle management doesn’t buy into the metrics, they won’t execute on them. Involve key stakeholders early in the design process.
- Set It and Forget It. A Balanced Scorecard is a living document. If you review it once a year, it’s useless. It should be the centerpiece of your monthly management meetings. If a metric is consistently “green” for three quarters, maybe it’s time to replace it with a more challenging one.
Beyond the Spreadsheet
The Balanced Scorecard requires a shift in mindset. It demands that leaders stop obsessing over the day’s fluctuating stock price and start obsessing over the foundational health of their organization.
By balancing your view across financials, customers, processes, and people, you create an organization that is resilient, aligned, and capable of executing on even the most ambitious visions.
Strategy is not what you write in a PowerPoint deck once a year. Strategy is what you measure, monitor, and manage every single day.