In a startup, a recurring figure is the visionary founder who “just knows” what the market wants. They lead with passion, move at breakneck speed, and treat data as an afterthought to their intuition.
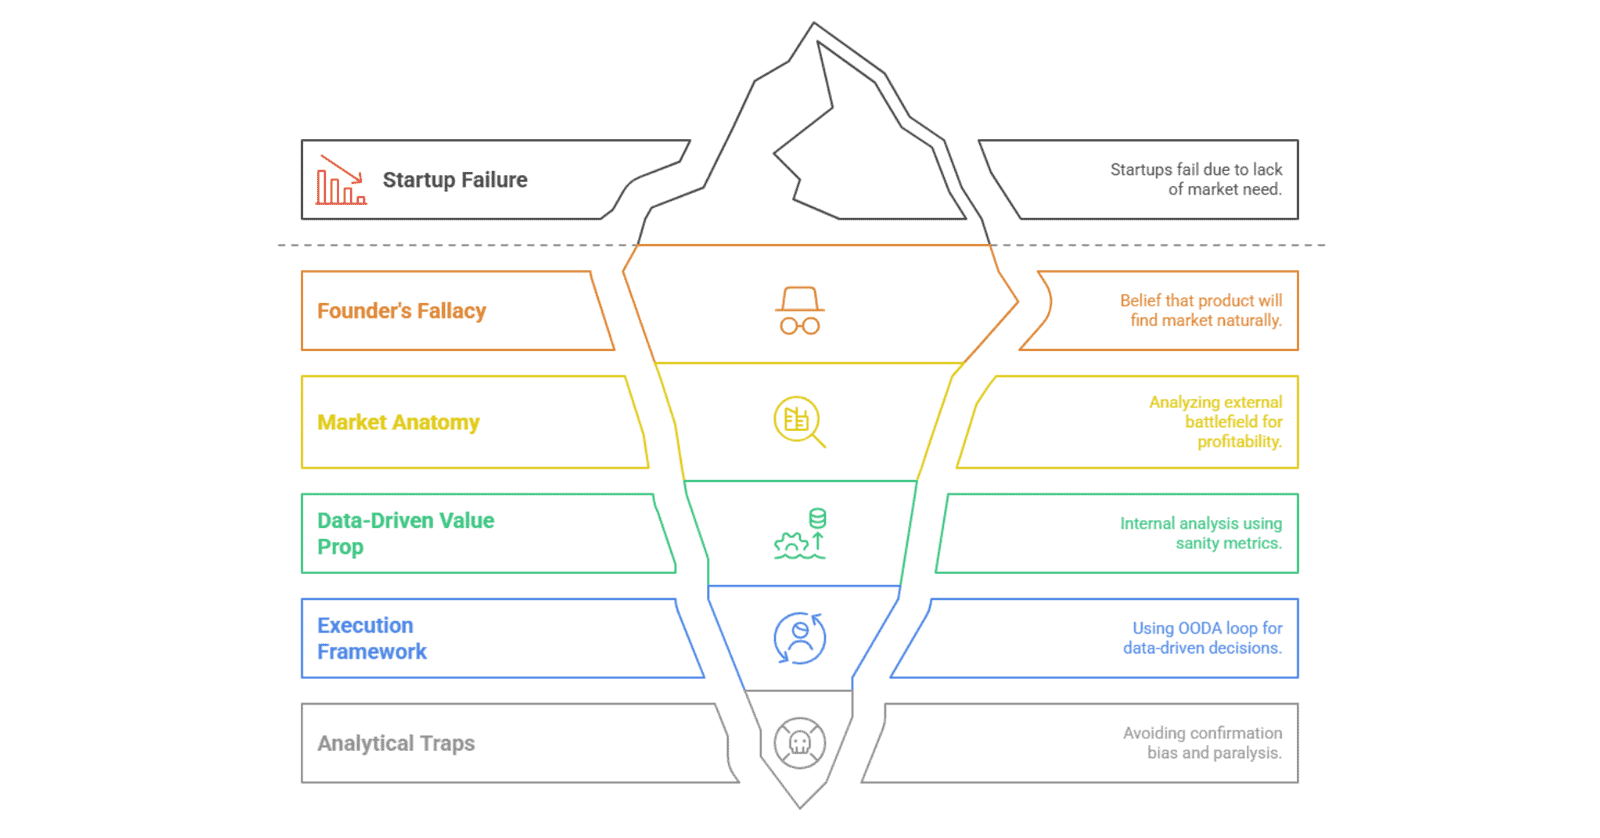
But in the current economic climate, intuition is no longer a reliable compass. According to recent venture data, nearly 42% of startups fail not because of poor coding or bad branding, but because of a “lack of market need.” In other words, they built a solution for a problem that didn’t exist, or at least, wasn’t painful enough for people to pay to solve.
This is the “Founder’s Fallacy”: the belief that a great product will naturally find its market through sheer force of will. To survive today, you must pivot from a culture of guessing to a culture of analysis. Whether you are launching a Business-to-Business (B2B) SaaS platform, a sustainable Consumer Packaged Goods (CPG) brand, or a deep-tech hardware company, the strategic process remains the same.
Strategy is not a static vision statement hanging on a wall; it is a hypothesis validated by rigorous, ongoing analysis.
Market Anatomy: Mapping the External Battlefield
Most pitch decks feature a slide with three concentric circles: Total Addressable Market (TAM), Serviceable Available Market (SAM), and Serviceable Obtainable Market (SOM). While these provide a sense of scale, they are often used as “vanity metrics” for markets. Accurate strategic analysis goes deeper into the Market Anatomy; the fundamental components and structures that define how markets function, encompassing elements from the basic forces of supply and demand to complex market structures and cycles.
Beyond the Billion-Dollar Slide
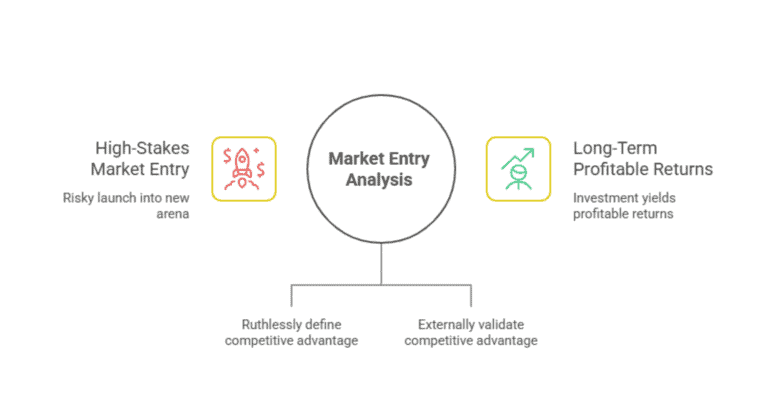
To win, you don’t need a billion-dollar market; you need a Pocket of Profitability. This is a segment where customer pain is high and acquisition cost is low. Analysis begins by identifying where existing solutions are failing.
Porter’s Five Forces in the Age of AI
Michael Porter’s Five Forces framework is more relevant than ever, but the variables have shifted:
- Threat of New Entrants: In 2025, AI has lowered the barrier to entry for software. If your only moat is “we have an app,” you have no moat.
- Bargaining Power of Suppliers: For many startups, “suppliers” are now cloud providers and LLM developers. If your margins are tied to API costs you can’t control, your strategy is fragile.
- Competitive Rivalry: Don’t just look at who is in the space; look at their velocity. Are they hiring? Is their social sentiment dropping? Use tools like G2 or TrustPilot to find the “feature gaps” your competitors are ignoring.
The PESTLE Scan
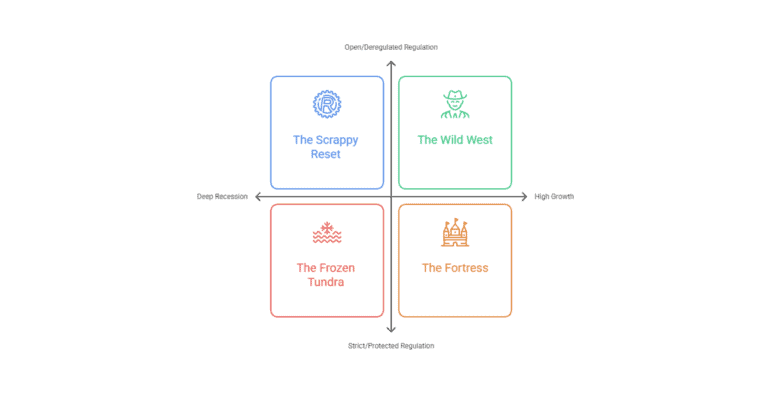
A strategic leader, PESTLE analyzes macro-shifts (Political, Economic, Social, Technological, Legal, Environmental) to catch tailwinds. For example, a fintech startup that analyzed upcoming “Open Banking” regulations in 2023 was positioned to dominate in 2025, while those who ignored the legal landscape are now scrambling to comply.
The Data-Driven Value Prop: Internal Analysis
Once you understand the battlefield, you must analyze your own arsenal. This is where many startups lose their way by tracking “vanity metrics” (likes, downloads, page views) instead of “sanity metrics.”
Defining Your North Star
Your North Star Metric should be the singular value that represents the core of your business.
- Airbnb doesn’t care about app opens; they care about Nights Booked.
- Slack doesn’t care about total users; they care about Messages Sent (a proxy for retention).
If your North Star Metric isn’t growing, your strategy isn’t working, no matter how much VC funding you have in the bank.
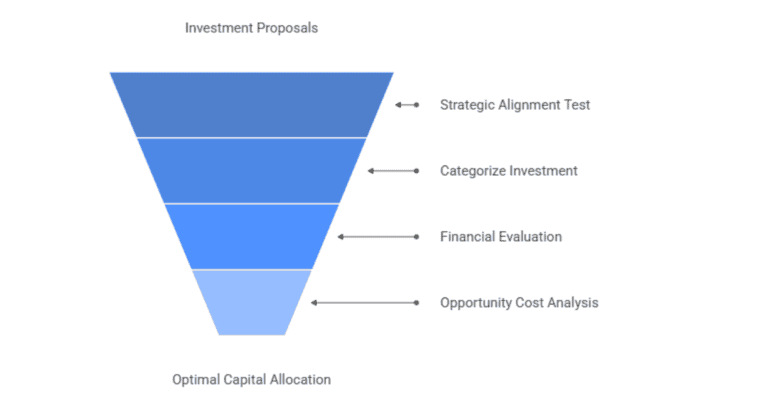
The Unit Economics Litmus Test
You cannot “scale your way out” of bad math. Before you pour fuel on the fire, you must analyze two critical ratios:
- LTV (Lifetime Value) > 3x CAC (Customer Acquisition Cost): The Lifetime Value of a customer must be at least three times the Cost to Acquire them. If your CAC is $100 and you only make $150 over the life of that customer, your business is a “walking ghost.”
- Payback Period: How many months does it take to recoup your CAC? In a high-interest-rate environment, a 24-month payback period is a death sentence. Aim for 12 months or less.
Actionable SWOT 2.0
The traditional SWOT (Strengths, Weaknesses, Opportunities, Threats) is often a “fill-in-the-blank” exercise that gets filed away. Instead, use an Actionable TOWS Matrix:
- Strategy S-O: How can we use our Strength to exploit this Opportunity?
- Strategy W-T: How can we shore up this Weakness to survive this Threat?
The Sector-Agnostic Execution Framework
Data analysis is useless if it doesn’t lead to a decision. Successful startups across all sectors utilize an OODA Loop (Observe, Orient, Decide, Act).
- Observe: Collect raw data from the market and your product.
- Orient: Contextualize that data. (e.g., “Our churn is high, but only among users who haven’t completed the onboarding tutorial.”)
- Decide: Formulate a hypothesis. (“If we make the tutorial mandatory, churn will drop by 15%.”)
- Act: Run the experiment.
The Decision Journal
To combat “hindsight bias,” keep a Decision Journal. When you make a strategic pivot, document:
- The decision is being made.
- The data points supporting it.
- The expected outcome.
- The date you will review the results.
This prevents the “I knew it all along” syndrome and builds a library of institutional knowledge that is worth more than any proprietary code.
Common Analytical Traps (And How to Avoid Them)
Analysis is a double-edged sword. If handled poorly, it can lead to “Analysis Paralysis” or, worse, “Misleading Confidence.”
Confirmation Bias
This is the silent killer of startups. Founders often seek out data that confirms their existing beliefs while dismissing “outlier” data that suggests they are wrong.
The Fix: Assign a “Devil’s Advocate” in every strategic meeting whose sole job is to argue for the opposite conclusion based on the same data.
Correlation vs. Causation
Just because users who use “Dark Mode” stay longer doesn’t mean “Dark Mode” causes retention. It might be that your most power users prefer Dark Mode.
The Fix: Run A/B tests to isolate variables before committing significant resources to a change.
The Cost of Waiting
In a startup, speed is a competitive advantage. You will never have 100% of the data.
The Rule: If a decision is reversible, act when you have 60% of the information. If it is irreversible, wait for 80%. Never wait for 100%.
From Analyst to Architect
The transition from a “gut-feeling” founder to a “data-driven” strategist is the hardest leap an entrepreneur can make. It requires humility, the willingness to be proven wrong by a spreadsheet.
However, once you stop guessing and start analyzing, your role changes. You are no longer just a dreamer hoping for the best; you are an architect building a business on a foundation of reality. You will find that investors are more confident, employees are more aligned, and pivots are less painful because they are guided by evidence, not ego.
The sectors change, from AI-driven healthcare to brick-and-mortar retail, but the math of success does not.
Don’t guess. Analyze. Win.